
On this page:
Why we’re setting housing targets
Housing targets are crucial for housing affordability and choice. They ensure we can build enough homes to meet your needs. Targets help:
- improve housing affordability for you by delivering different types of homes at a range of prices, particularly in areas where you want to live
- with strategic planning for infrastructure and services that stimulate local economies and provide greater planning certainty for business investment and more local jobs.
About the targets
This plan sets out housing targets for every local government area across Victoria, specifying their share of the extra 2.24 million homes we need.
The targets will ensure that every planning scheme identifies enough realistic opportunities for new development to deliver the targeted number of homes.
We’ll assess each planning scheme to ensure it can deliver its target. We’ll work with councils to make the necessary changes to planning schemes, particularly to zones and overlays and how they are applied, so the targets are met.
Setting the housing targets
The fairest, most sensible way to work out where new homes should be located is to:
- prioritise locations well-provided with jobs, shops, public transport and community facilities and services
- channel some growth away from Melbourne to provide the benefits of growth to communities in regional cities and towns
- protect natural values and Traditional Owners’ culture and values
- understand and manage environmental risks (such as flooding, rising sea levels and bushfires)
- maintain our agricultural areas.
The maps on this page show each local government area’s housing target for 2051, bringing to life our commitment for at least 70 per cent of homes to be built in established areas (noting the adjusted approach for Greater Geelong and Ballarat), reflecting the criteria above. The targets might be met by building more townhouses and small and medium-sized apartment buildings or some larger apartment buildings in areas with great public transport. The targets will also enable the short-term imperative to deliver affordable housing in our growth areas.
We’ve included sub-targets for greenfield land for metropolitan Melbourne’s growth area councils. These sub-targets recognise the different planning processes required to realise development on greenfield land compared to non-greenfield land. The regional councils of Greater Geelong, Greater Bendigo and Ballarat also have sub-targets for greenfield land that moves them closer to building 70 per cent of homes in their existing urban areas. The greenfield land sub-targets for the Greater Geelong and Ballarat regional councils represent a 40 per cent share of total new dwellings to 2051 due to local circumstances.
Implementing the housing targets
At the state level, we’ll amend all planning schemes so planning authorities – councils and other bodies writing planning rules – and responsible authorities – councils and other bodies deciding on planning applications – must implement the local government area housing targets and all other relevant actions in all future decisions.
The Victorian Government and other planners will also ensure consistency with this plan when they consider options and develop business cases for new infrastructure and services.
We acknowledge that councils work hard to plan for their municipalities and update their planning schemes within reasonable timeframes. But we’ll hold councils accountable with explicit directions to change planning schemes if they are not providing enough housing capacity, and, if required, we’ll step in to update schemes and work with councils to ensure they’re on track to achieve their target.
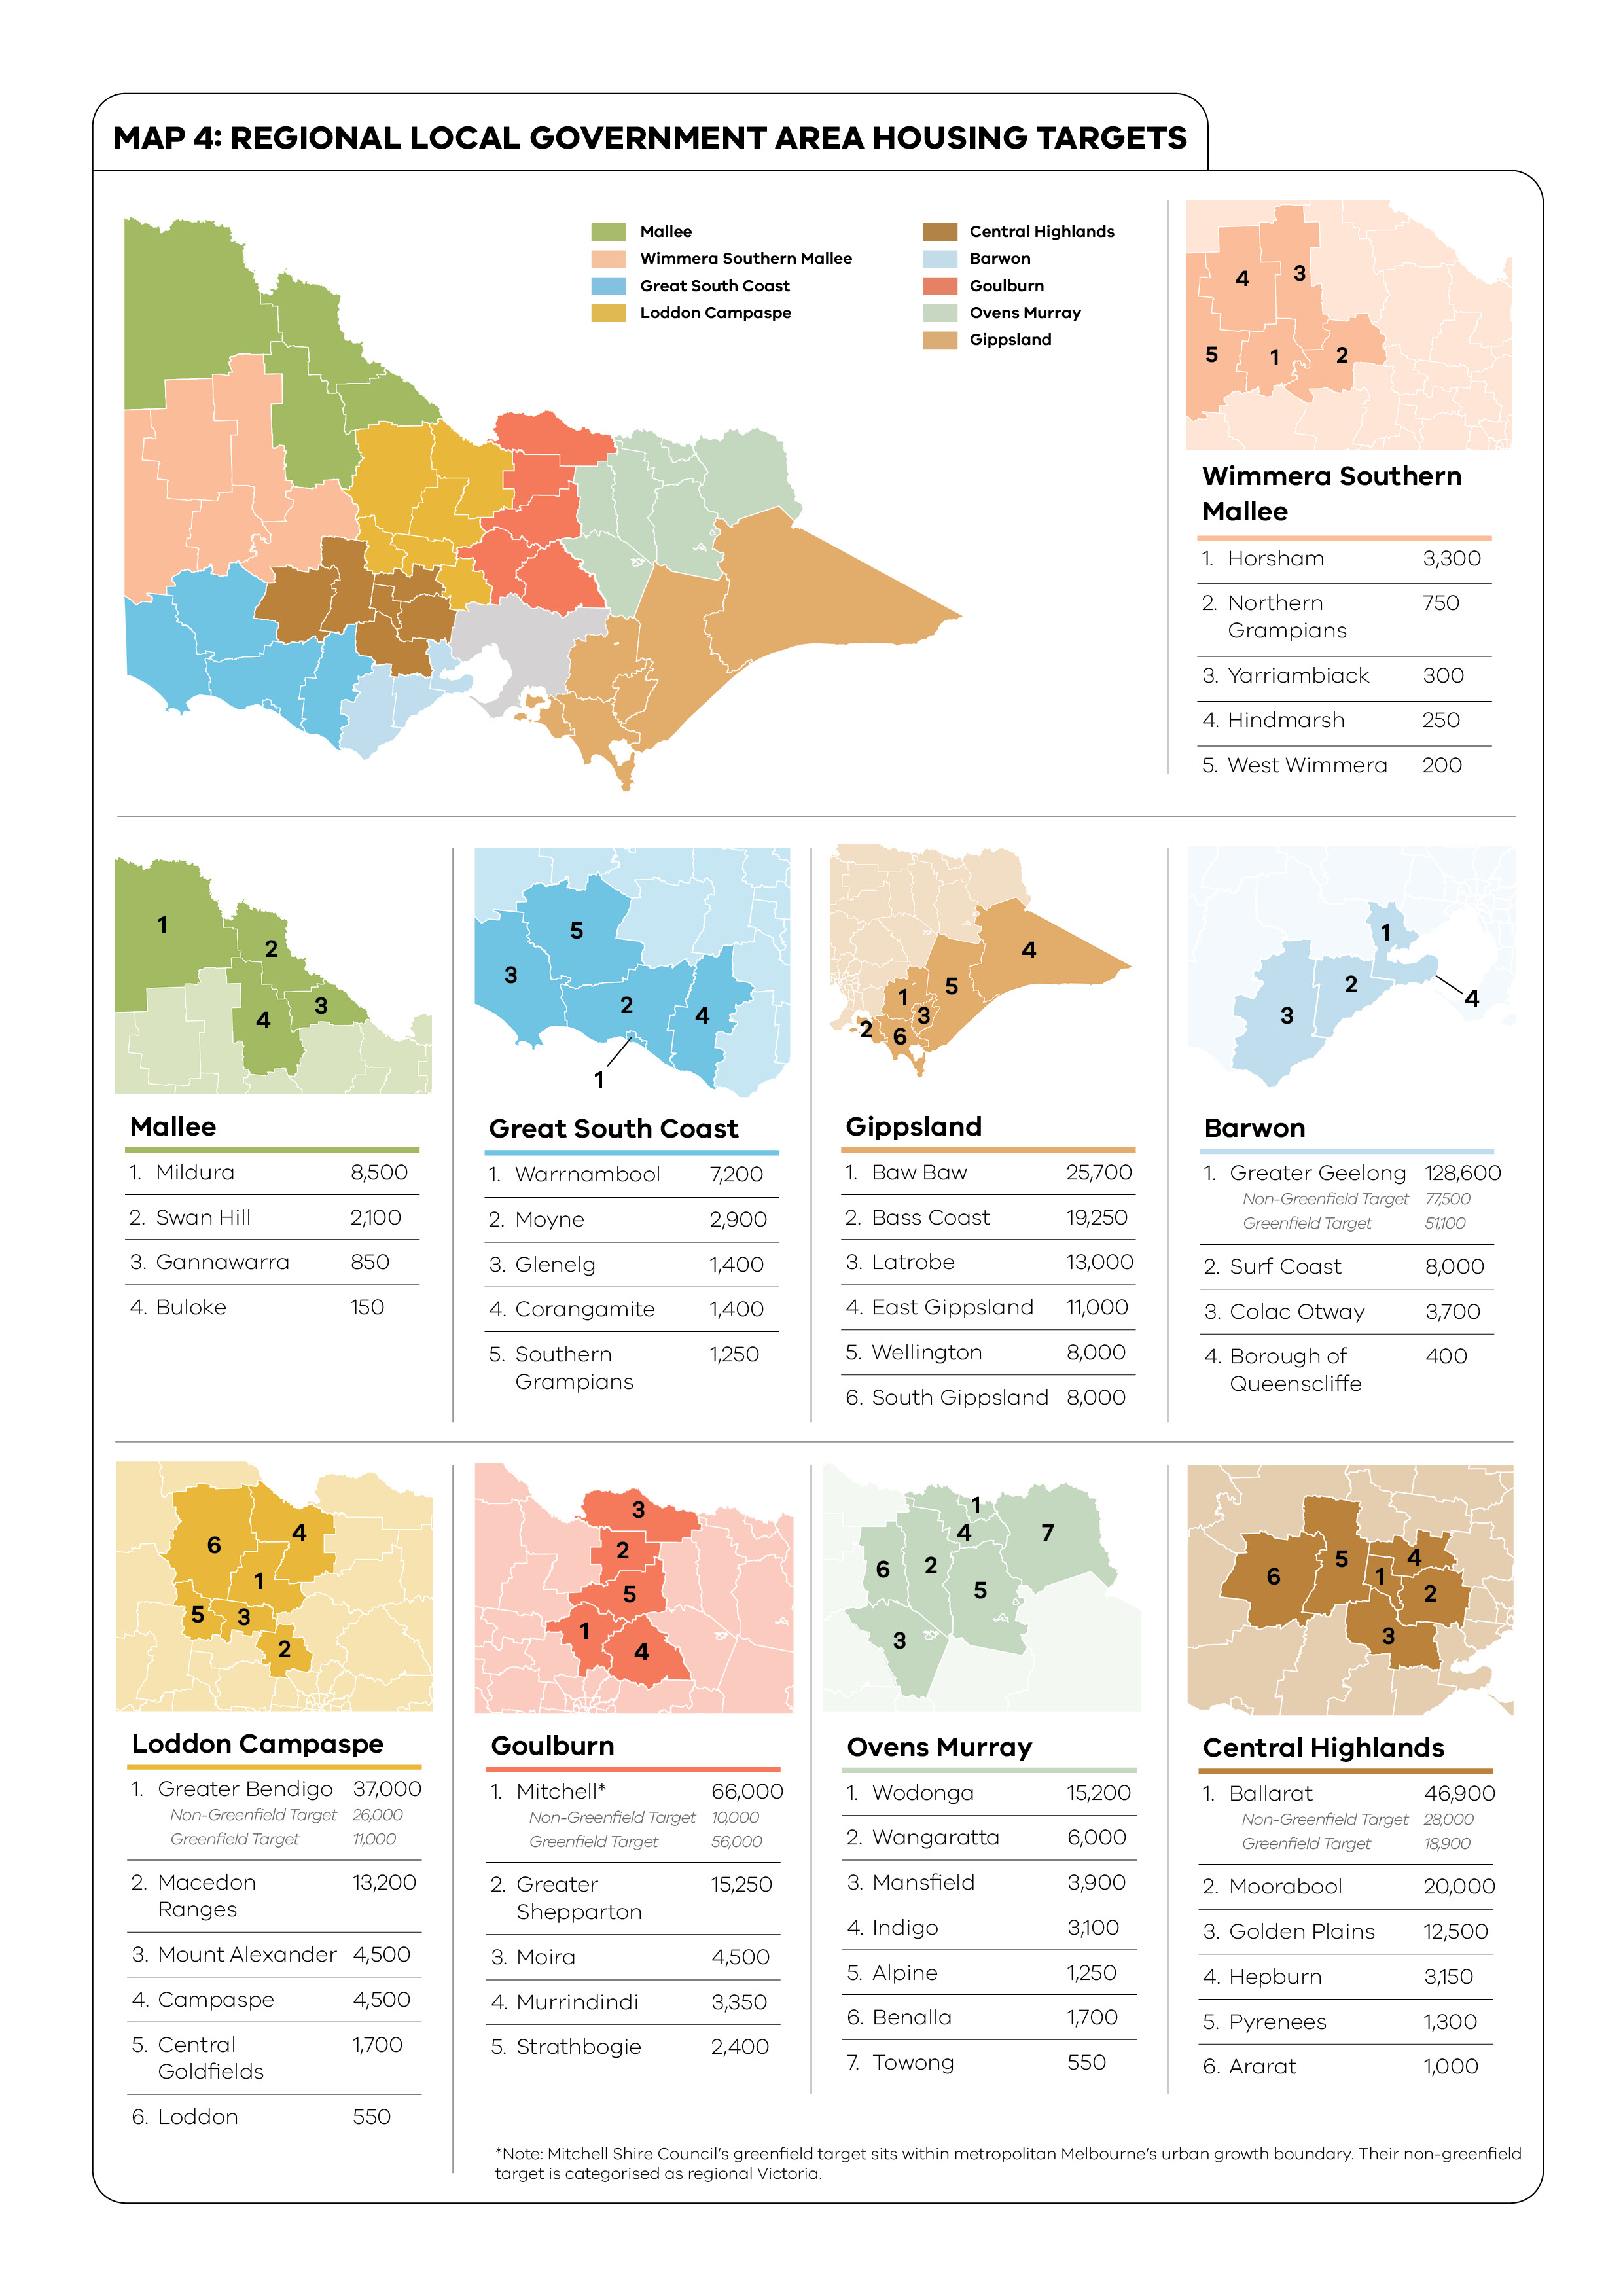
Map - regional local government area housing targets
| Local Government | Housing target – Net new dwellings to 2051 |
|---|---|
Alpine | 1,250 |
Ararat | 1000 |
Ballarat | 46,900 Non-greenfield target: 28,000 Greenfield target: 18,900 |
Bass Coast | 19,250 |
Baw Baw | 25,700 |
Benalla | 1,700 |
Buloke | 150 |
Campaspe | 4,500 |
Central Goldfields | 1,700 |
Colac Otway | 3,700 |
Corangamite | 1,400 |
East Gippsland | 11,000 |
Gannawarra | 850 |
Glenelg | 1,400 |
Golden Plains | 12,500 |
Greater Bendigo | 37,000 Non-greenfield target: 26,000 Greenfield target: 11,000 |
Greater Geelong | 128,600 Non-greenfield target: 77,500 Greenfield target: 51,000 |
Greater Shepparton | 15,250 |
Hepburn | 3,150 |
Hindmarsh | 250 |
Horsham | 3,300 |
Indigo | 3,100 |
Latrobe | 13,000 |
Loddon | 550 |
Macedon Ranges | 13,200 |
Mansfield | 3,900 |
Mildura | 8,500 |
Mitchell | 66,000 Non-greenfield target: 10,000 Greenfield target: 56,000 |
Moira | 4,500 |
Moorabool | 20,000 |
Mount Alexander | 4,500 |
Moyne | 2,900 |
Murrindindi | 3,350 |
Northern Grampians | 750 |
Pyrenees | 1,300 |
Queenscliffe | 400 |
South Gippsland | 8,000 |
Southern Grampians | 1,250 |
Strathbogie | 2,400 |
Surf Coast | 8000 |
Swan Hill | 2,100 |
Towong | 550 |
Wangaratta | 6,000 |
Warrnambool | 7,200 |
Wellington | 8,000 |
West Wimmera | 200 |
Wodonga | 15,200 |
Yarriambiack | 300 |
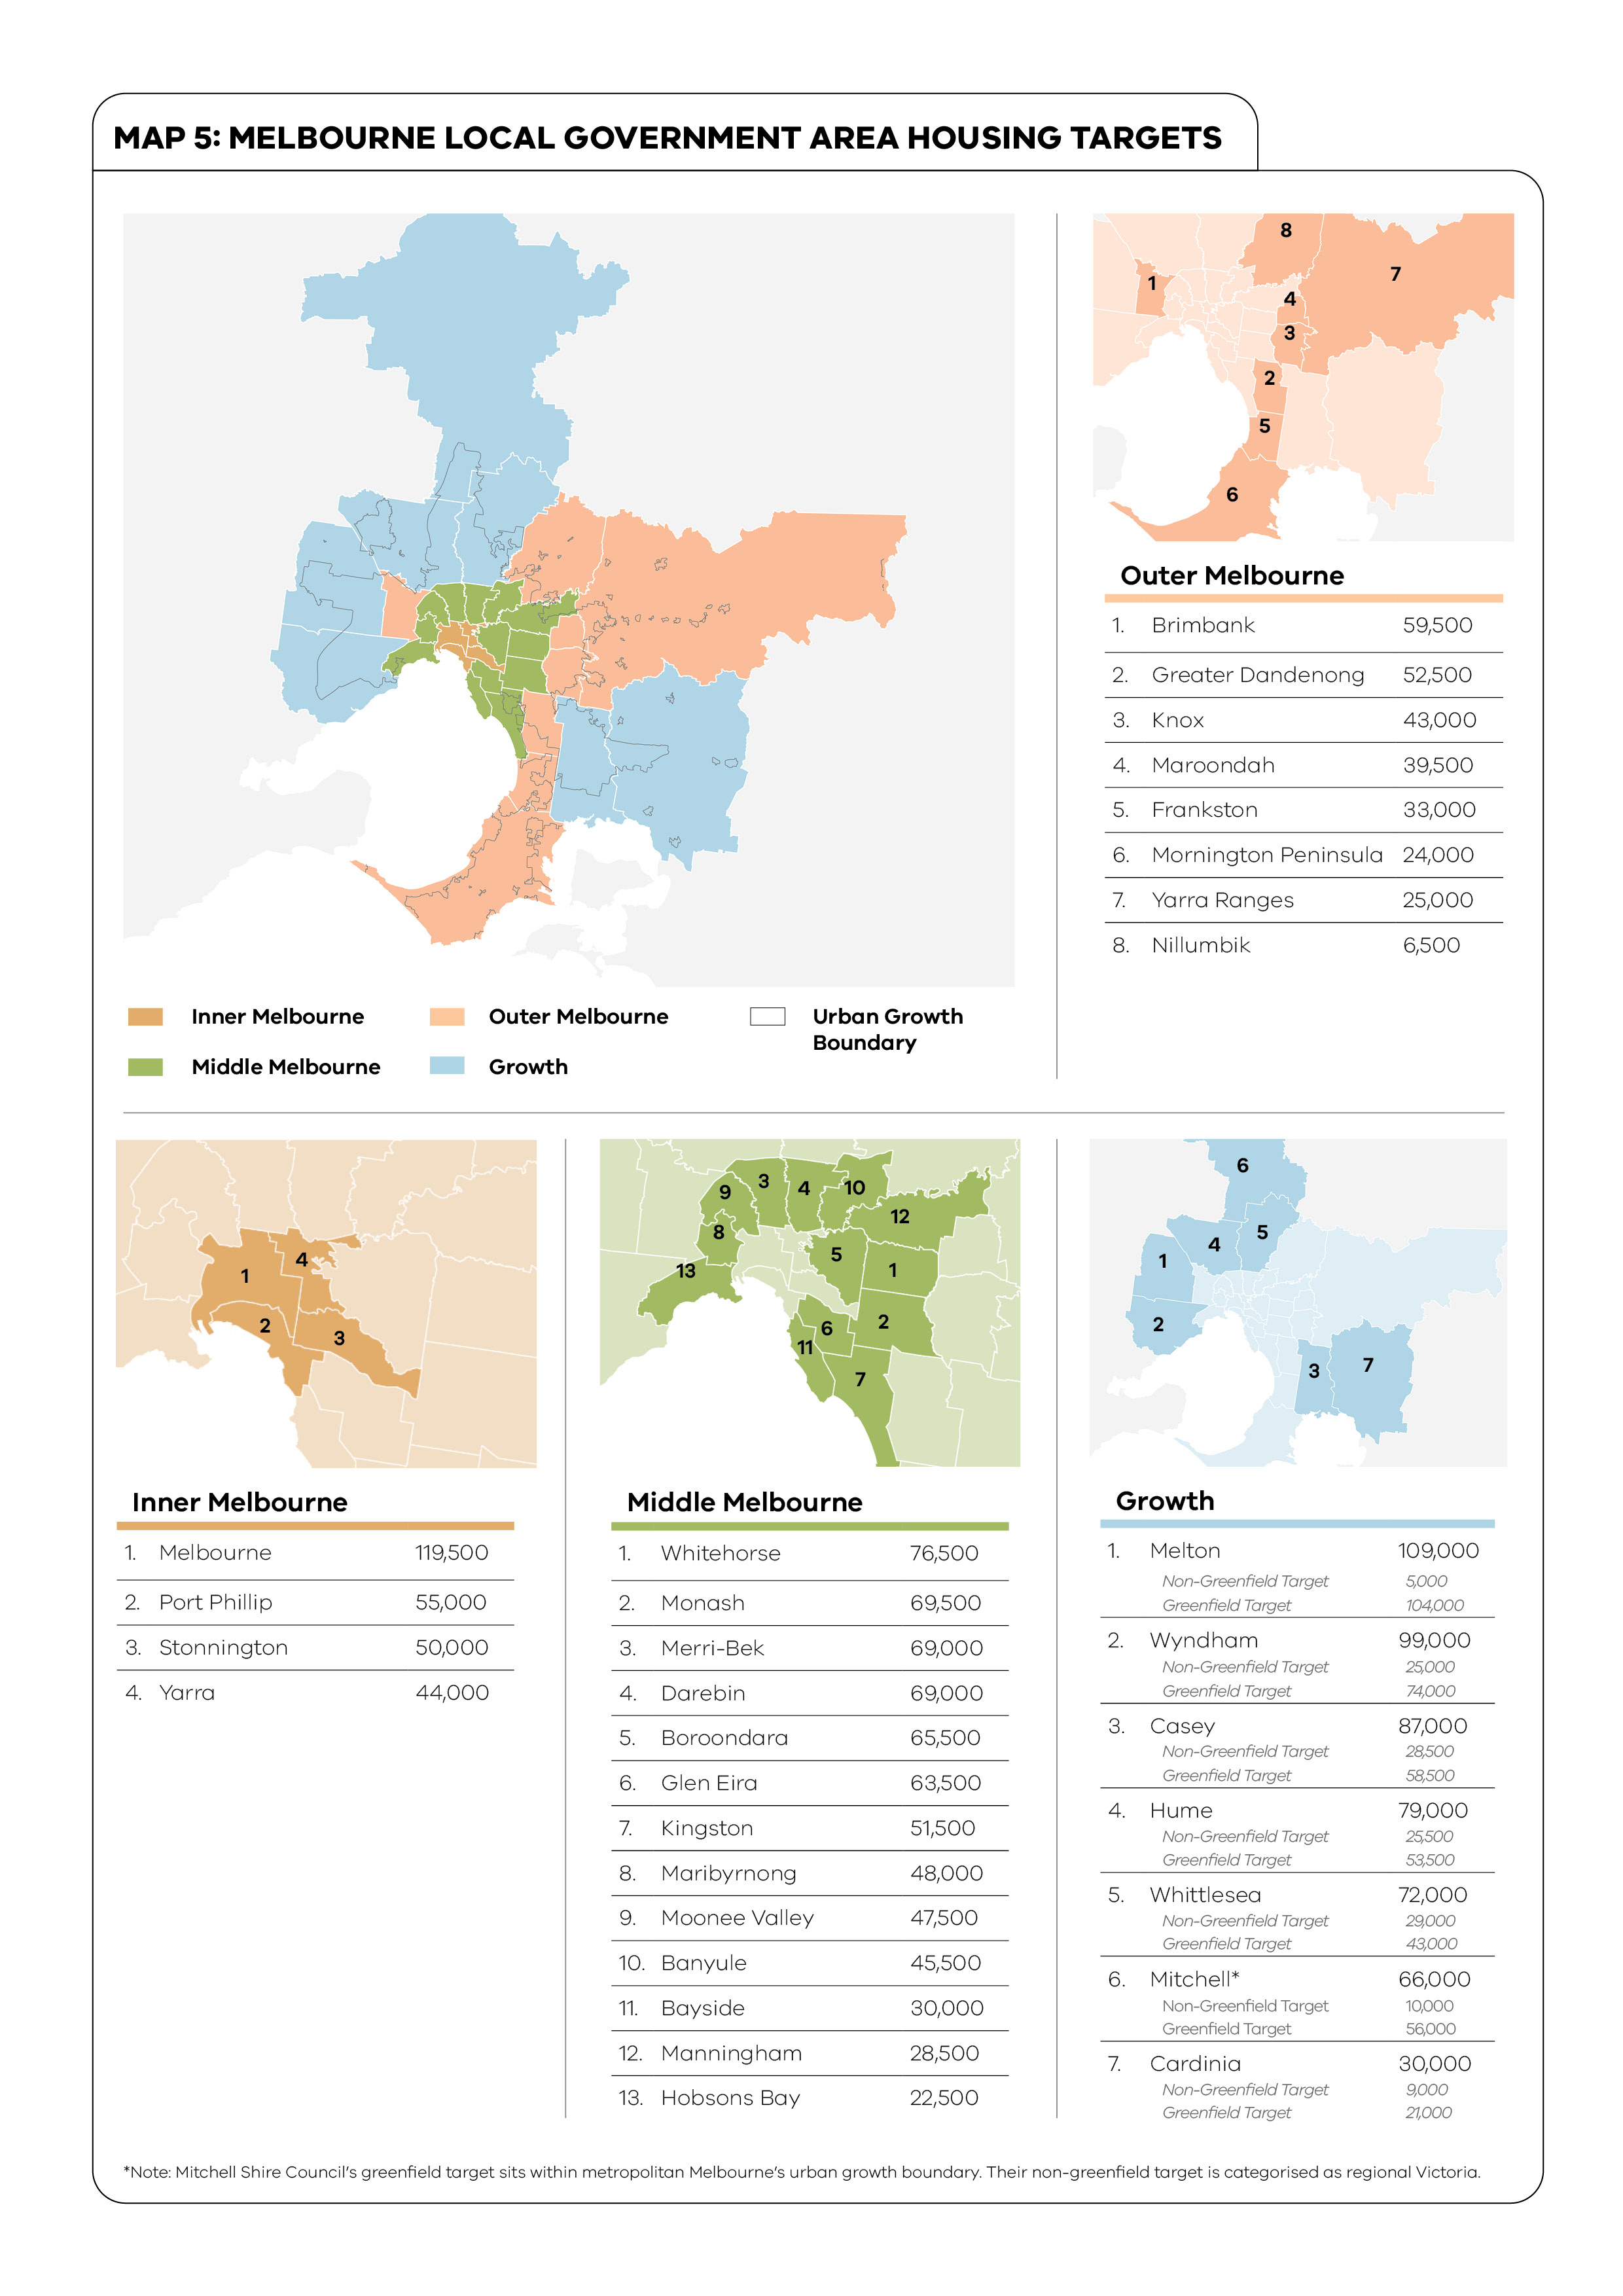
Map - Melbourne local government area housing targets
| Local Government | Housing target – Net new dwellings to 2051 |
|---|---|
Banyule | 45,500 |
Bayside | 30,000 |
Boroondara | 65,500 |
Brimbank | 59,500 |
Cardinia | 30,000 Non-greenfield target: 9,000 Greenfield target: 21,000 |
Casey | 87,000 Non-greenfield target: 28,500 Greenfield target: 58,500 |
Darebin | 69,000 |
Frankston | 33,000 |
Glen Eira | 63,500 |
Greater Dandenong | 52,500 |
Hobsons Bay | 22,500 |
Hume | 79,000 Non-greenfield target: 25,500 Greenfield target: 53,500 |
Kingston | 51,500 |
Knox | 43,000 |
Manningham | 28,500 |
Maribyrnong | 48,000 |
Maroondah | 39,500 |
Melbourne | 119,500 |
Melton | 109,000 Non-greenfield target: 5,000 Greenfield target: 104,000 |
Merri-bek | 69,000 |
Monash | 69,500 |
Moonee Valley | 47,500 |
Mornington Peninsula | 24,000 |
Nillumbik | 6,500 |
Port Phillip | 55,000 |
Stonnington | 50,000 |
Whitehorse | 76,500 |
Whittlesea | 72,000 Non-greenfield target: 29,000 Greenfield target: 43,000 |
Wyndham | 99,000 Non-greenfield target: 25,000 Greenfield target: 74,00 |
Yarra | 44,000 |
Yarra Ranges | 25,000 |
Page last updated: 11/03/25